
Solar and Battery Payback Calculator (with real data!)

I’ve been collecting data on my solar and battery installation for a whole year now so I have a pretty good idea of how it performs at different times of the year. Using that information I’ve been able to put together a model of how long it will take to cover its own costs from the savings it provides on my energy bills. In this article I’m going to show you all of my raw data and calculations so as you can see how I have arrived at my answer.
Download the Excel spreadsheet here (2022 version from the video):

Download the latest Excel spreadsheet here (last updated July 2025):
Octopus Energy using my referral link:
speaktothegeek.co.uk/energy

Existing customer? Find out how you can benefit too. T&Cs apply (only one switching offer per household)
My Installation
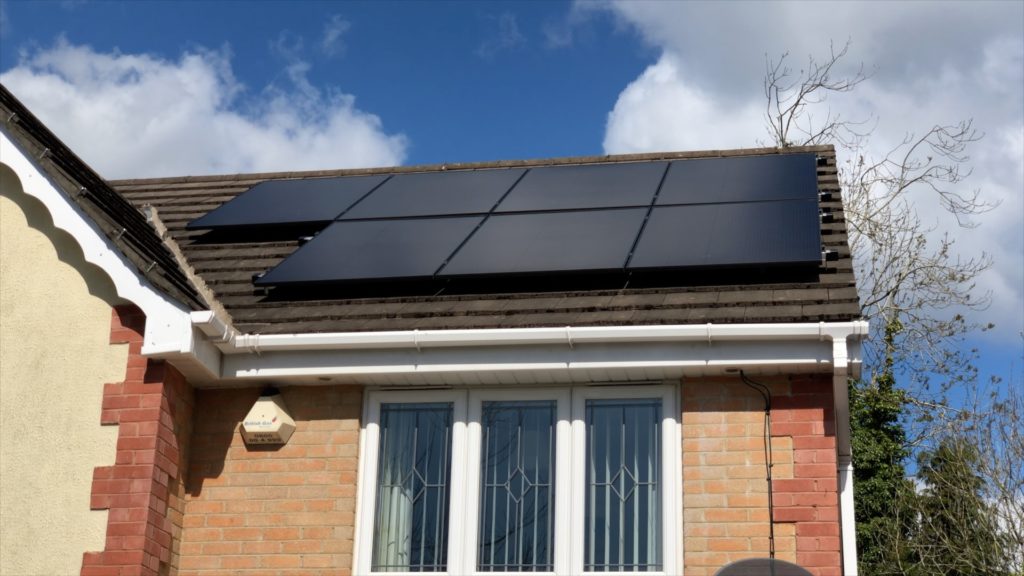
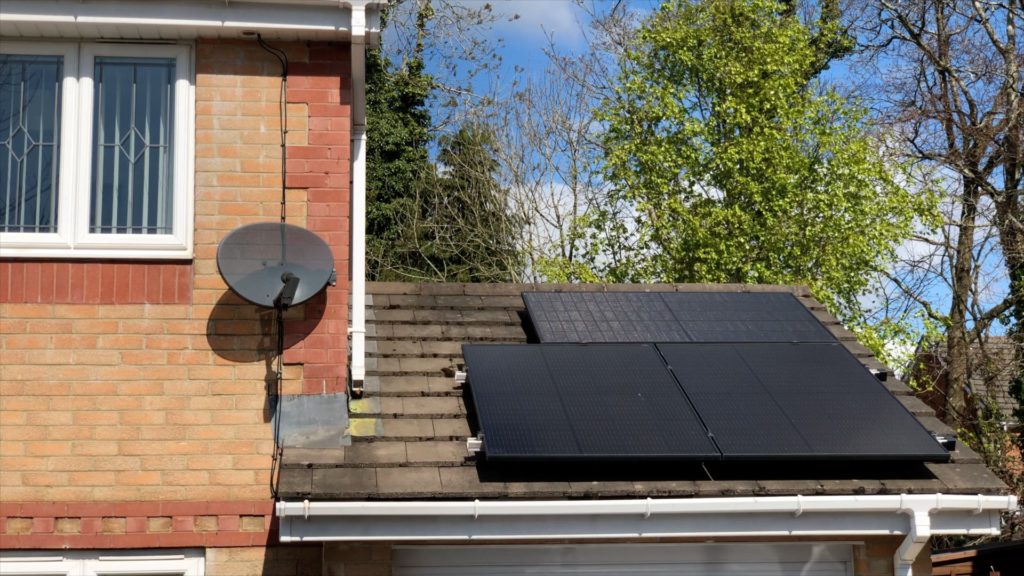
As a quick reminder (unless you've never read any of my other articles before in which case, how very dare you! 🙂 ), the solar and battery solution I have in my home consists of the following:
- 10x 390W Trina Vertex solar PV panels
- 10x SolarEdge power optimisers (one attached to each panel)
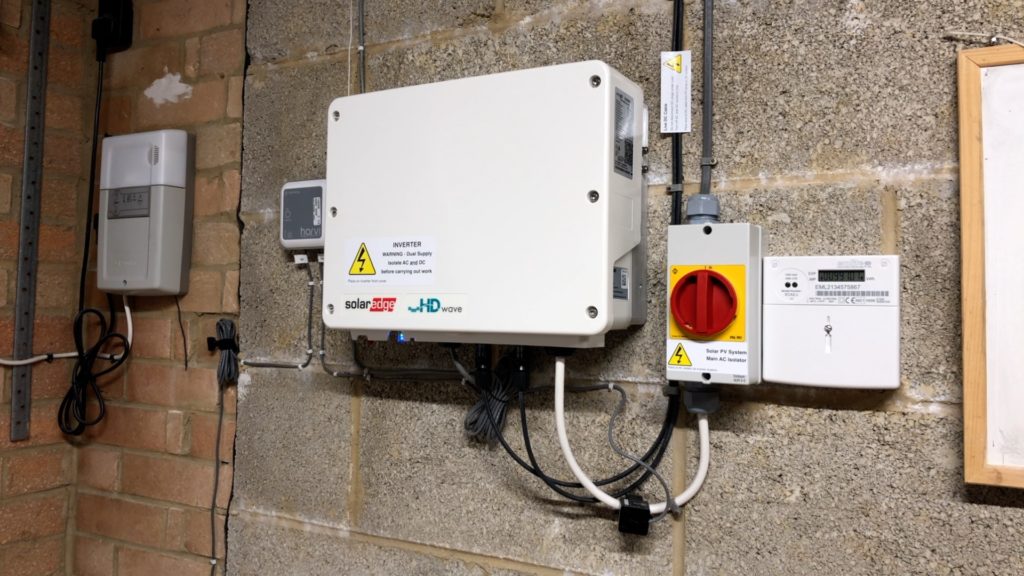
- SolarEdge SE3680H string inverter
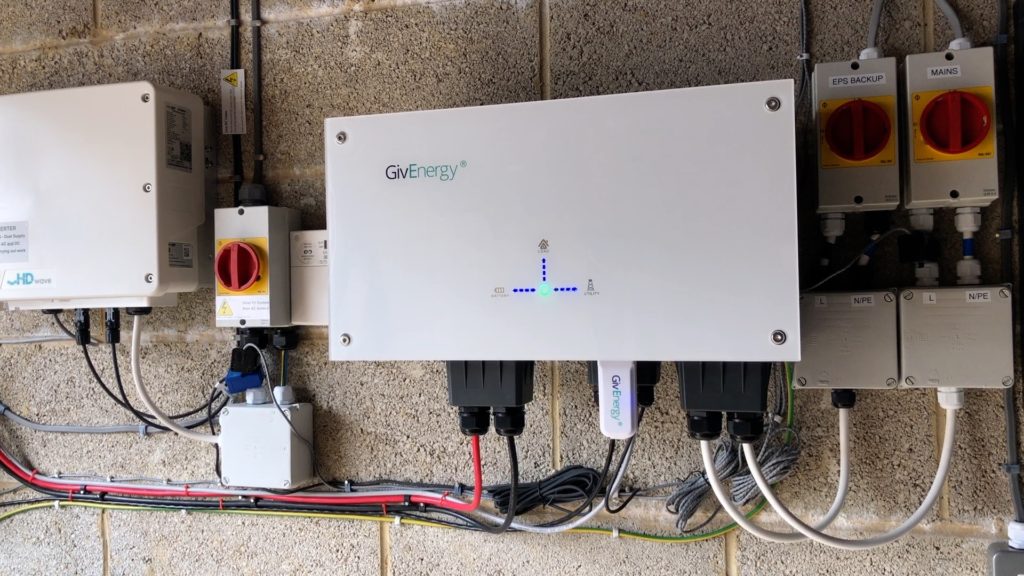
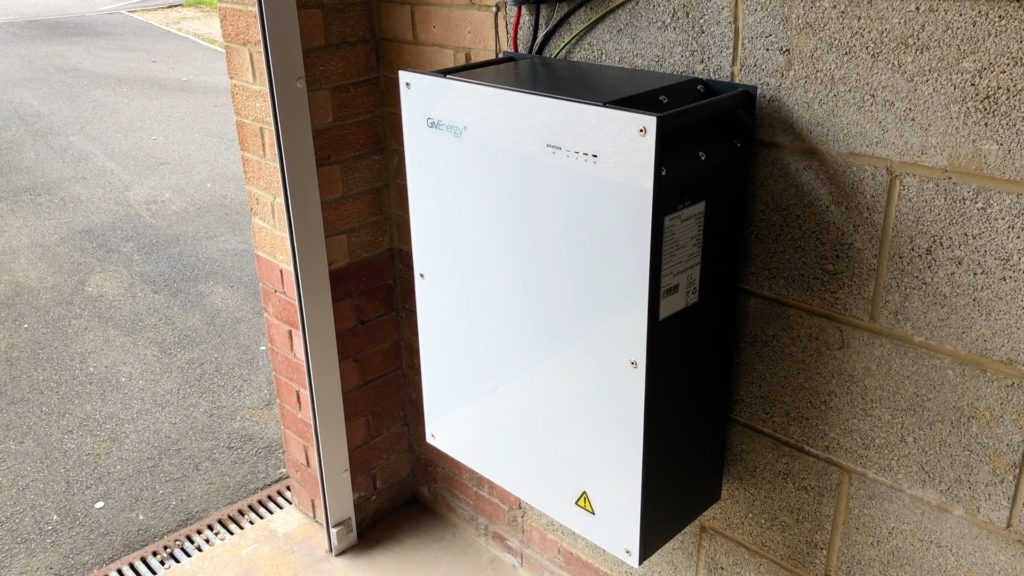
- GivEnergy Giv-AC3.0 inverter + 8.2kWh battery
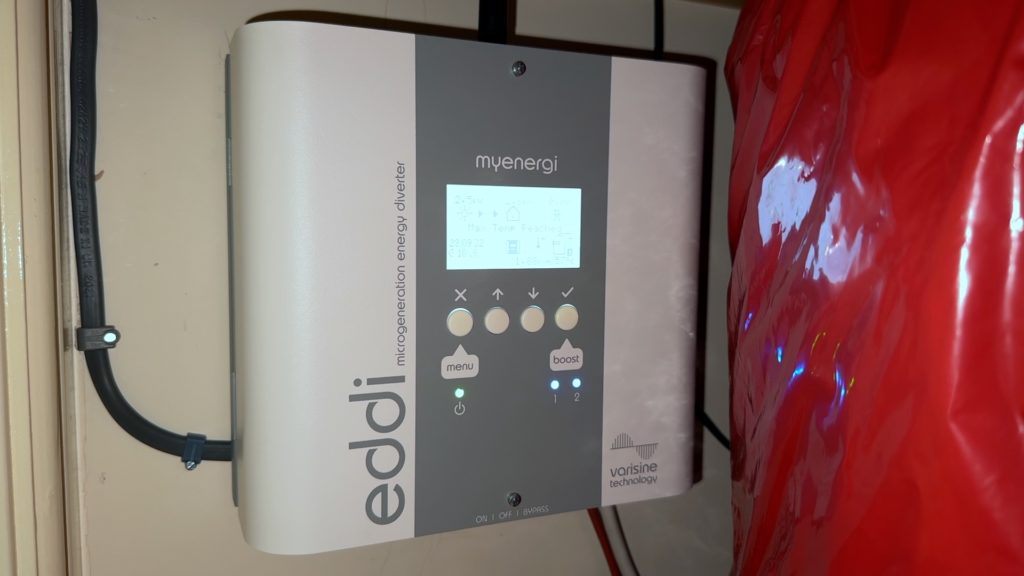
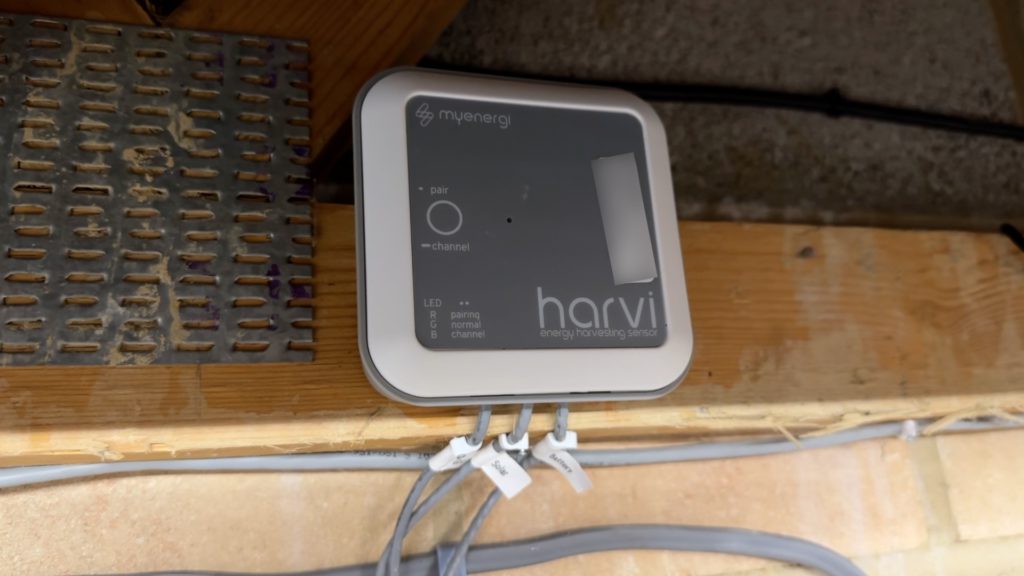
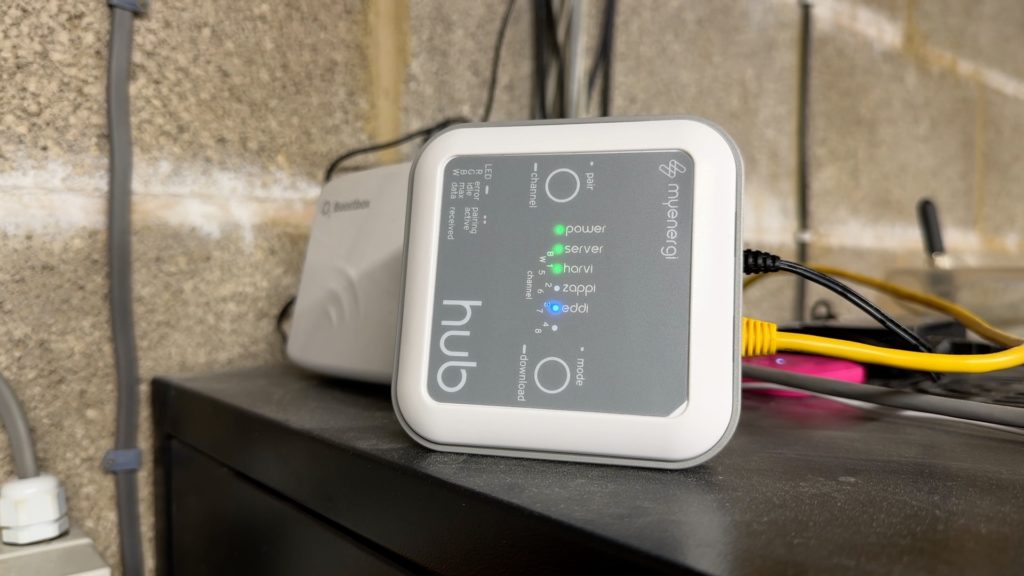
- Myenergi Eddi (hot water diverter) with hub, Harvi and 3x CT clamps
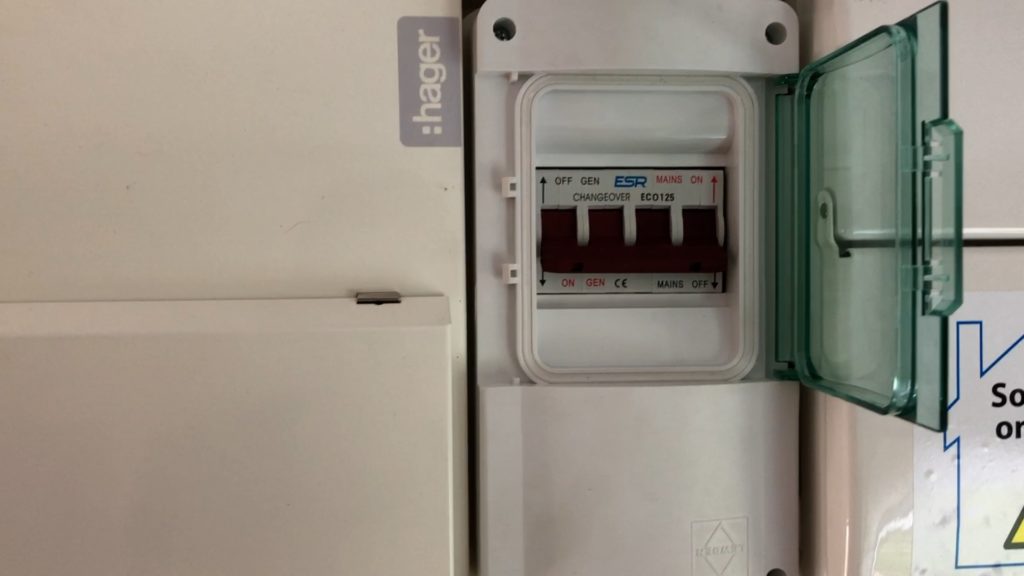
- EPS circuit for lights and emergency sockets
- Manual changeover switch for EPS
Costs
How much did this all cost then. Well, the main bill from my installer included the panels, optimisers, inverters, battery, Eddi, the additional work for the EPS and of course all of the wiring and installation. On top of that I then purchased a Myenergi hub and an extra CT clamp to monitor the solar generation, and I decided I needed the sensor and relay board for Eddi so as I could keep an eye on the water temperature in the tank too which involved buying the board, a PT1000 sensor, plus I added a third CT clamp to that order too so as I could monitor the battery feed. So the costs for all this are (and remember, these are based on quotes from August 2021):
- Main bill from installer: £9881.53
- Myenergi Hub + CT clamp: £108.12
- Eddi Sensor and Relay Board / PT1000 / CT Clamp: £65.95
- Total cost: £10,055.60
If money is all you care about then the burning question you’ll have is “How long until I get that money back?”. Well it is a very good question and one that’s not easy to give a definitive answer to because of many variable factors. However if you make a number of assumptions then it’s possible to get a reasonable idea. Before I go into my assumptions I need to admit that I’m actually still on an old Octopus Go tariff. This is a fixed rate until June 2023 so when you eventually see my calculations you will notice that the energy rates I’ve used are ridiculously low for 2022 and half of 2023.
Assumptions
What assumptions am I making then?
- The first one is that the current Octopus Go tariff, which is about 42p peak and 12p off-peak will apply for me from June 2023
- I’ll assume a 5% rate of inflation on those rates annually
- I’m going to assume that my energy demand does not change, so what I used in 2022 is going to be the same as 2023, and 2024 and so on
- I’m going to ignore my gas savings. I switched from heating my hot water using my gas boiler to using Eddi and the immersion heater
- I’m going to pretend also that there will be no faults or failures in the system. Most of the components are covered under a warranty of at least 5 years, some are 20 years. If there’s a failure that ends up costing me then I’ll have to re-assess the payback timeframe
- I will be ignoring panel degradation. PV panels will lose efficiency over time but as with my assumption around my demand, I’m going to assume that generation is also static year on year
- And finally I’m going to ignore the potential lost interest from buying this system versus what you might have earned if you’d put the money in a bank account. There’s a very good reason for this and I’ll discuss that later on.
Gathering the Data
Before I can predict how much my system might save me in energy costs per year, I’ll need to know how much it actually saved me during the year that I’ve had it so far. I used Home Assistant to collate all of the energy data from various sources, and then at the end of each month I would summarise that data in a spreadsheet. Note that I'm getting this data directly from my smart meter using a Glow IHD/CAD (see this article), and the SolarEdge inverter's modbus feed (which I discuss in this article).
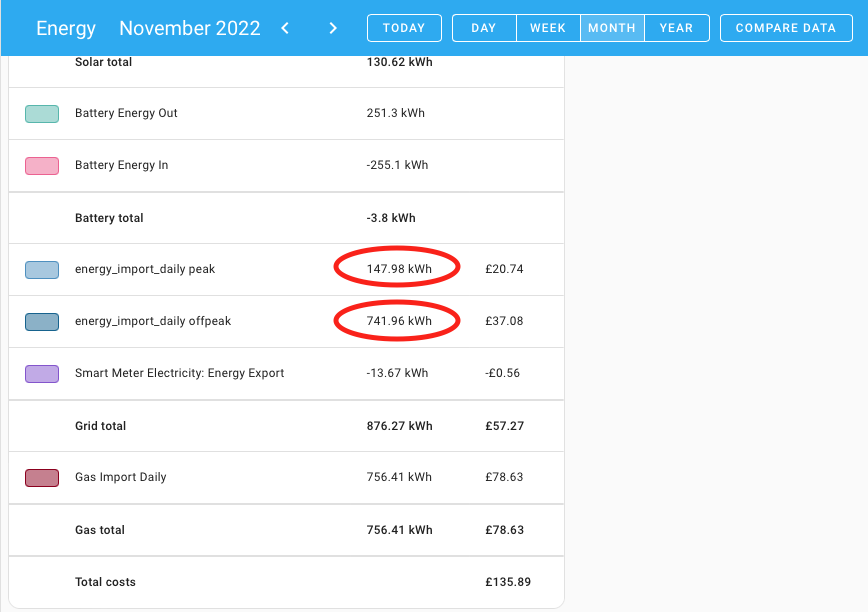
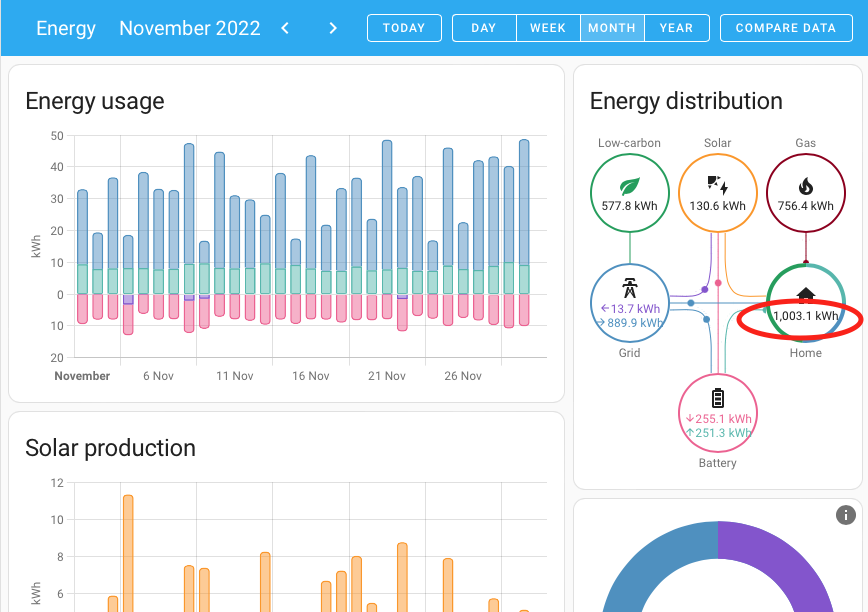
Looking on Home Assistant’s energy dashboard, I was after the monthly values for how much energy I drew from the grid at peak and off-peak times, and then also the actual household demand of energy. For these calculations you don’t actually need to know how much solar generated, because essentially that’s wrapped up in your household demand.
Over to my spreadsheet then, I entered that data into it for each month along with details of the tariff I paid per kWh. Take a look at the very first month in the list, November 2021. I didn’t have solar at all that month, but my split between peak and off-peak usage was 54% in favour of peak. By using solar and a battery, the aim is to reduce both the total draw from the grid, and also skew that usage in favour of off-peak.
So for each month I already know how much that energy cost me to buy. What I need to do is estimate how much my total demand would have cost me if I didn’t have solar or a battery that month. Well, taking the assumption that when I didn’t have solar or a battery 54% of my usage was at peak, I calculate the cost of 54% of that demand at the peak rate, 46% of that demand at the off-peak rate.
Finally I subtract the actual cost from the estimated cost, then add on the amount received for any exported energy to give me an estimated saving on my bill. Doing that every month for 12 months gives me an estimated monetary saving for the whole year.
But… forget the money for a minute, because rates can and probably will change every year. What we’re really interested in here is the total annual demand in kWh versus the amount we imported at both peak and off-peak times for the whole year.
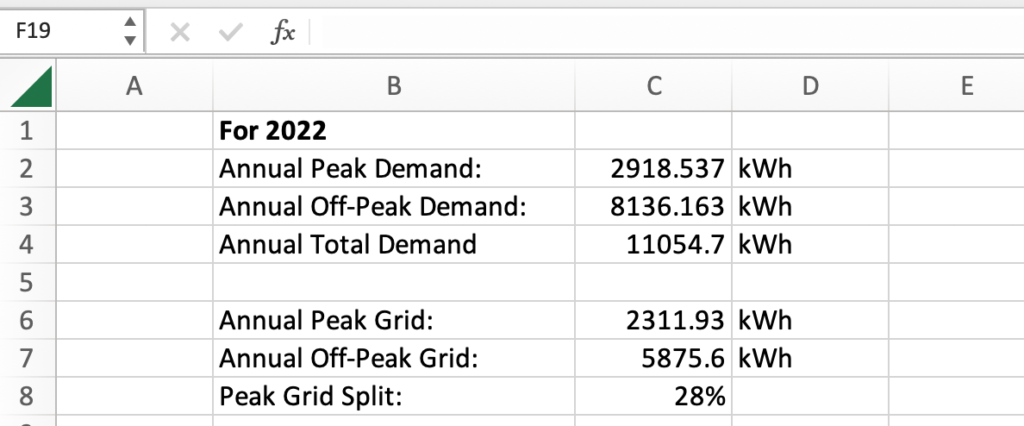
In a different part of my spreadsheet I have totalled up this data for 2022. My total demand for the year was just over 11,000kWh, made up of about 8100kWh off-peak and just under 3000kWh peak. But looking at my actual grid draw that was only 5875kWh at peak and 2311kWh off-peak, so on average over the whole year only 28% of my usage was at peak.
Now we’re ready to take all of this data and feed it into my main payback calculator spreadsheet.
The Payback Calculation
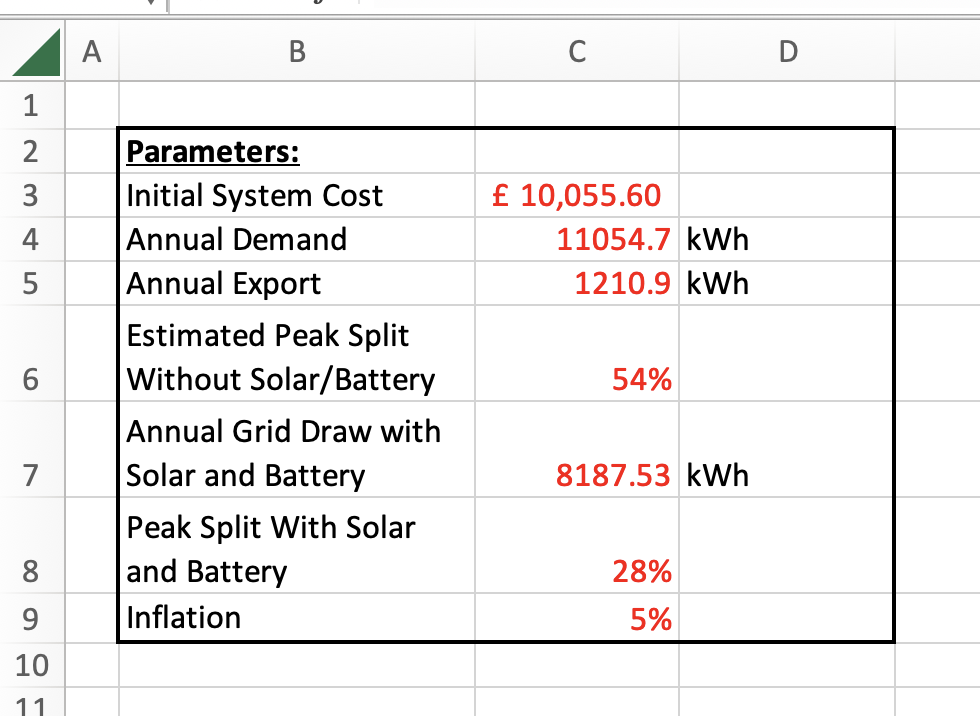
At the top of my spreadsheet is a parameters section and in there you'll need to enter all of the various values connected with your historical data and assumptions before you begin. You tell it how much your system cost to install, how much your actual energy demand is (remembering that this is not how much you draw from the grid, this is how much you actually need to use regardless of whether that comes from the grid or your solar panels). You’ll need to tell it how much you export in a year, the split of peak to off-peak usage when you didn’t have solar or batteries - this was my 54% figure from the November before the installation. Then fill in your total annual grid draw, and the percentage of that which will be at peak times, so that’s 28% for me if you remember, and finally you tell it a rate of inflation and I’ve chosen 5%.
Once you’ve sorted out the input data then we take a look at the colourful table below the parameters.
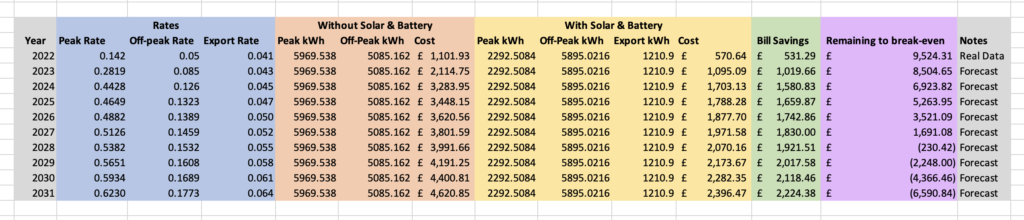
For the year 2022, I’ve put this in as static data because I know how much I’ve saved - £531.29. This purple column near the end is going to keep track of how much I’ve eaten in to my initial investment.
For 2023, you’ll notice what still appears to be low tariff rates. This is because I’ve taken an average of my current low Go prices and the newer much more expensive Go prices. For 2024 onwards, I’ve taken the latest Go tariff data, increased it by inflation, and then carried that on for the remaining years.
For each year, I’ve broken down the calculation steps so as you can see how much it reckons you’ll have paid for your energy without solar, how much you would pay for it with solar and a battery, and therefore the difference between those is your estimated bill savings that year.
And on these assumptions, how long will it therefore be before my energy savings have paid for the installation costs of the system? Drum roll please….

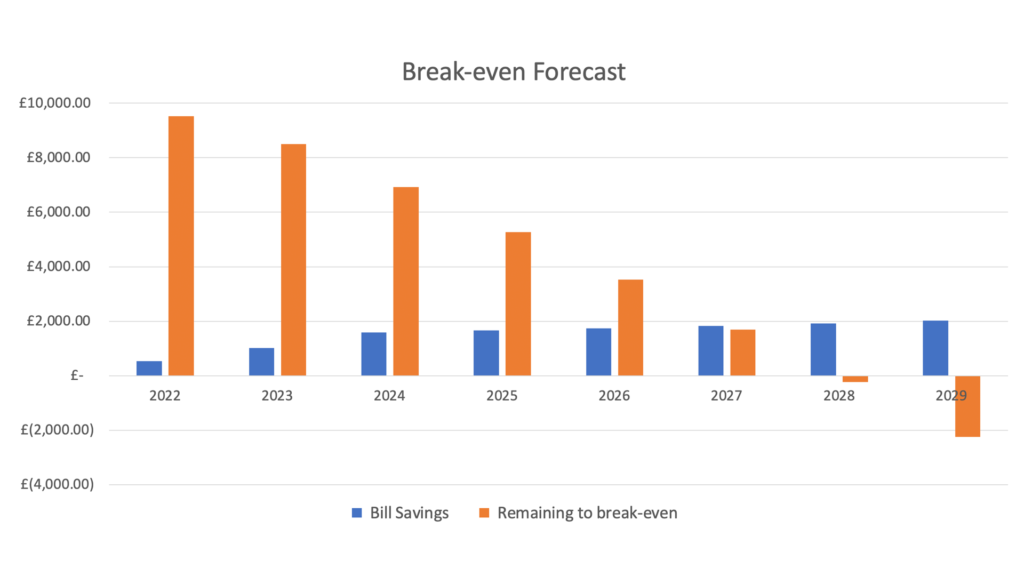
And How Long For Payback?
7 years. Well, during the 7th year I will break even! The main reason for such as quick payback time is because of the sky-high energy costs right now. I don’t think they’ll come back down to where they were for a long time personally, but because they’re so high, payback is much sooner than it would have been if I’d done these calculations a couple of years ago.
Earlier on when I listed my assumptions, I said that I wasn’t going to include lost interest in these calculations so I’m going to explain why. The reason is that you should consider this as a standalone investment in itself, and you can pick the time period over which you wish to calculate your return on investment and compare the final value with other investment products as you see fit. If you were to try and include lost interest in the break-even calculation itself, then you can no longer compare it against other investment products.
Let me show you what I mean. I’ve already calculated that my system should pay for itself during its 7th year. By the end of the 8th year, I will have actually made an additional £2248 in energy bill savings which is a 22% return. At the end of the 9th year I’ll have made a 43% return, 10 years and that’s 65%. A 10 year investment with a potential for a 65% return sounds like a good investment to me. This works because once your system has covered its initial cost, it’s now just sitting there generating free energy and helping shift your usage around to improve your energy cost efficiency.
Just like any other investments, there are risks such as hardware failures or energy costs diving again, but don’t forget that not only are you likely to save real cash money here, you’re also reducing your impact on the national grid, helping make it a greener grid.