
Are North Facing Solar Panels Worth Installing?

I’ve been wondering if it would be worth having more solar panels installed but the problem is that the only available space on my roof faces north-west. If you live in the northern hemisphere then you’ll know that this isn’t ideal because the sun is generally in the south. So for the past few months I’ve been running a bit of a simulation to see how much energy north-facing panels on my home might have generated, and whether it would be a worth-while investment.

This is a satellite view of my house, with north directly up. I’ve had solar panels fitted on the south-east facing roof, 7 panels on the main roof, 3 on the garage (marked in blue on the image). Now, I use the solar forecasting feature in Home Assistant to provide me with solar forecast data for these panels, and that helps me make decisions on how much I might need to charge my battery over night, or which days might be best to put the washing machine on. Basically, how much energy will my solar panels be generating day by day.
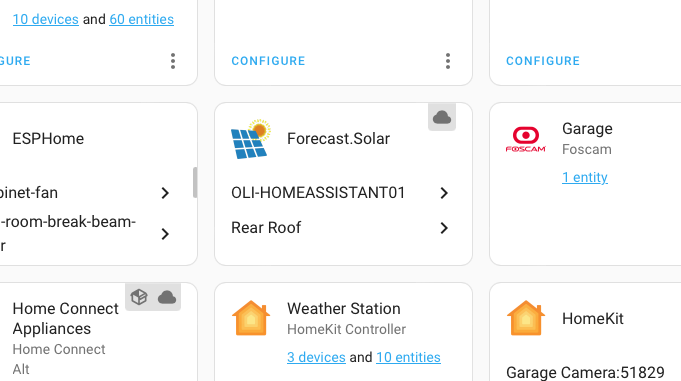
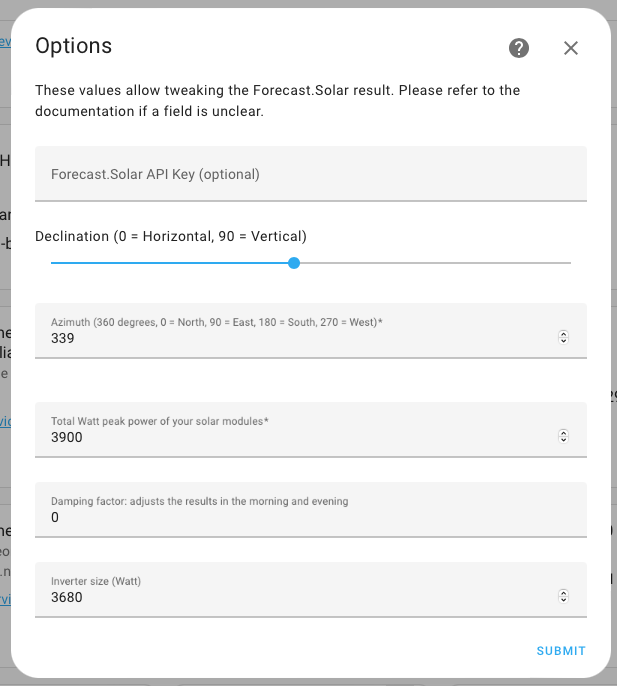
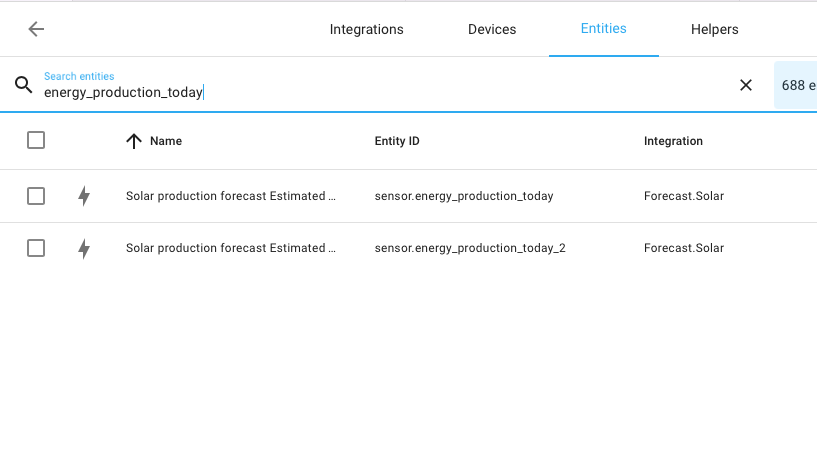
Then I thought, what if I had panels on the north-west facing roof (marked in red)? Well, I collect this forecast data for my real solar panels, why can’t I collect data for some fake panels? So that’s exactly what I’ve been doing for several months. Using the Forecast.Solar integration, I already had my built-in front-roof configuration (which I didn’t name very well, ok because I didn’t think ahead), so I just added a second one called ‘Rear Roof’. My front roof is 3.9kWp on a 3.68kW inverter, so for the rear roof I used exactly the same details but set it to the opposite aspect: north facing. That gave me two sensors of interest: sensor.energy_production_today for the front roof, and sensor.energy_production_today_2 for the fake panels on the rear roof.
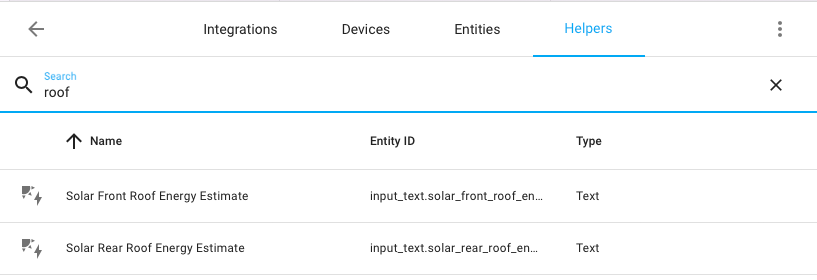
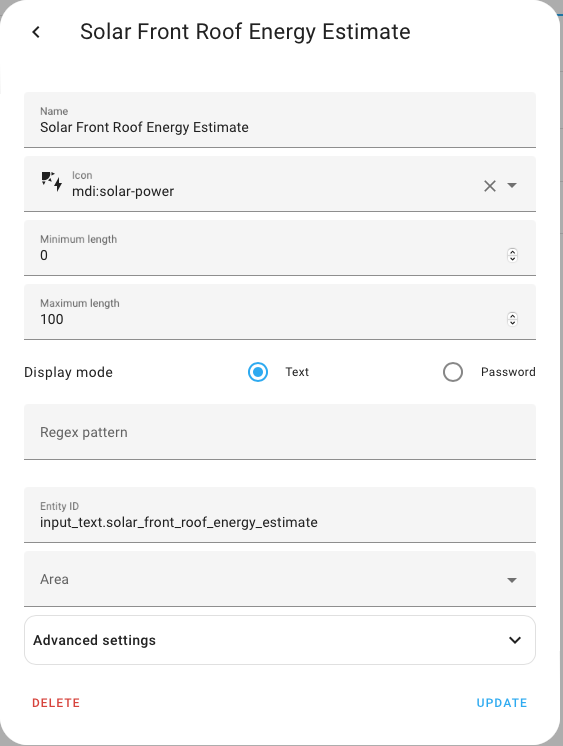
Those two sensors store the solar forecast’s estimates for what should have been generated by your panels today. Next I created a couple of text helpers (see images below) which will each be used to store a cumulative total of the estimated solar energy generation for each particular solar array.
An automation then runs every night at 8pm and takes the daily forecast sensor value and adds it on to whatever is stored in the text helper.
alias: Solar Energy Estimates
description: ""
trigger:
  - platform: time
    at: "20:00:00"
condition: []
action:
  - service: input_text.set_value
    data:
      value: >-
        {{
        (states('input_text.solar_rear_roof_energy_estimate')|float(default=0) +
        states('sensor.energy_production_today_2')|float(default=0))|string }}
    target:
      entity_id: input_text.solar_rear_roof_energy_estimate
  - service: input_text.set_value
    data:
      value: >-
        {{
        (states('input_text.solar_front_roof_energy_estimate')|float(default=0)
        + states('sensor.energy_production_today')|float(default=0))|string }}
    target:
      entity_id: input_text.solar_front_roof_energy_estimate
mode: single
And then finally I have a couple of template sensors that convert the text from the text helper into an actual number and present it as an energy reading. I know, it’s a very long winded way to get to this point but bear with me, because I now have two energy sensors that can used in Home Assistant’s energy dashboard!
template:
  - sensor:
    - name: Solar Rear Roof Energy Estimate
      state: "{{ states('input_text.solar_rear_roof_energy_estimate')|float(default=0) }}"
      unit_of_measurement: "kWh"
      state_class: total_increasing
      device_class: energy

    - name: Solar Front Roof Energy Estimate
      state: "{{ states('input_text.solar_front_roof_energy_estimate')|float(default=0) }}"
      unit_of_measurement: "kWh"
      state_class: total_increasing
      device_class: energy
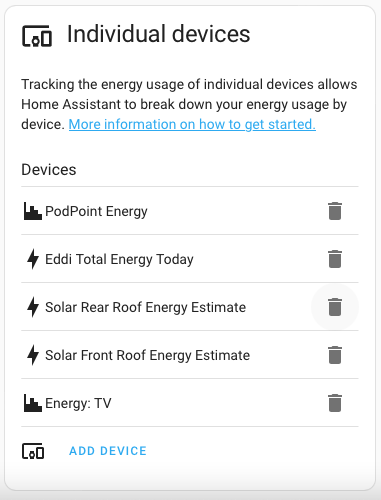
I have added both sensors as Individual Devices and that means that when I look on my dashboard, down near the bottom both estimates are tracked as long term statistics. I can see how much energy these estimates were for whatever reporting period I like, such as daily, monthly or even yearly.

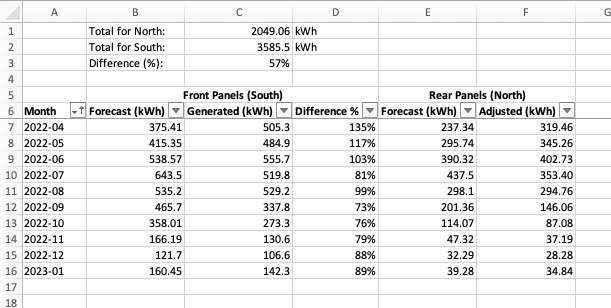
So that’s how I collected the data, so then I needed to do something useful with it. That means it’s time for another spreadsheet. I created a little table in Excel that I used to record each month how much generation was forecasted for my real front panels, I also then noted how much was actually generated, then calculated the ratio of how different the forecast was to reality. Then I recorded how much was forecast for my fake panels and applied that same adjustment ratio to that forecast to come up with hopefully a more realistic estimate of how much those panels might have produced that month.
Up at the top I’ve kept a total of how much was actually generated by my real panels, how much is predicted to have been generated by the fake panels, and then a calculation of how different the two are. So you can see here that my north facing panels would only produce 57% the amount of energy compared to the south facing panels.
So already that’s going to give you an idea on how worthwhile it is having north-facing panels installed, it’s clearly going to take a lot longer than south-facing panels for them to cover their own costs. But we can try to come up with a figure for that time period. In order to do that I need to make a few assumptions. Let’s say that a 3.9kWp solar only installation consisting of 10 panels and a string inverter costs £6000 to install. I’m basing this on rough estimates from when I had my front panels installed.
Now we need to figure out how much solar energy might be exported vs how much we’ll self consume. I looked back at my data for 2022 and I generated 3846kWh from my south facing panels. I exported 1128kWh, and that’s an export to generation ratio of 29%. But I also have a battery, so some of my self-consumption was actually just redirected excess solar into the battery. If I had extra panels installed, I’d have to consider that my batteries are probably already full so I’d have nowhere to store it. On average last year my battery soaked up 3kWh of solar every day. Some days it was 8, some days it was nothing, but it averaged out at 3. That’s 1095kWh of north-facing generation that I need to assume will be added straight on to the grid export estimate.
Now let’s plug this data into another spreadsheet. I’ve put the initial system cost in at the top, the estimated solar generation from these fake north panels, an offset for the battery energy that I can’t store, and the export estimate of 29%. It calculates the split between how much will be exported and how much I will self-consume here, and then I stick in an inflation value. The inflation value will be applied to the energy rates.
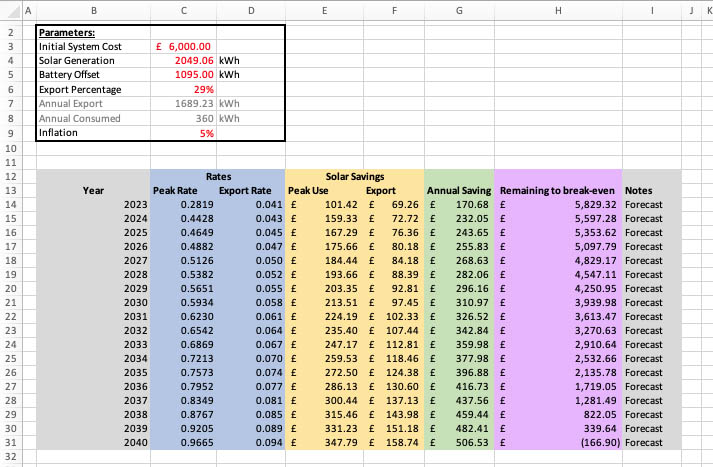
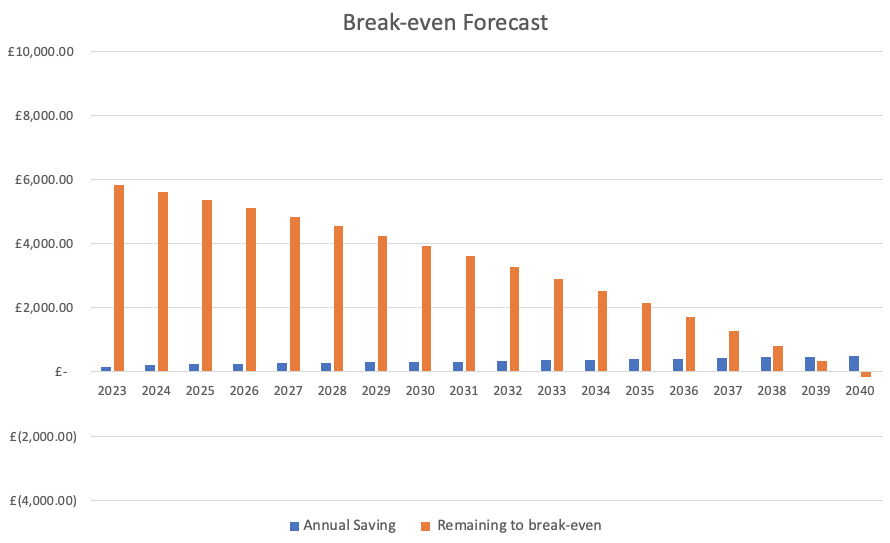
Now, for the first year, and I’ve pretended here that I installed these fake panels right at the start of 2023, you fill in the unit rate per kWh that you pay for peak rate electricity and your export rate, then the spreadsheet will automatically complete the rest for you. It’ll calculate how much you’ll be saving and exporting per year, then keep a running total of how far you are eating into that initial investment. Of course I‘m excluding potential interest earned on that initial cost for the sake of simplicity here.
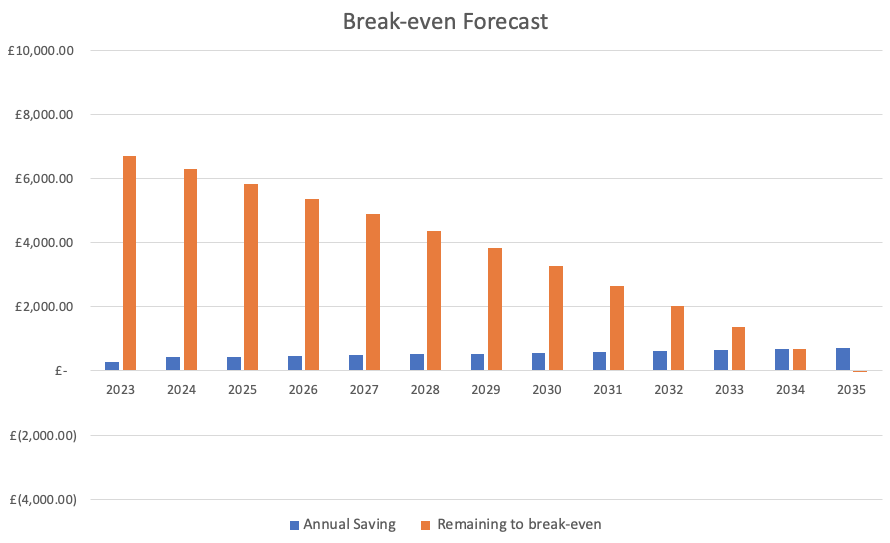
So did you notice the results? Yes, 18 years. If all went well, and my estimations were correct, it would take 18 years to get my money back on north facing panels for me. But if I were to have panels fitted on that roof, there’s a bit more space there because there’s no dormer in the way. I reckon I’d be able to get 14 panels, or at least 12 panels each with a higher capacity. Instead of 3.9kWp, I reckon I’d get almost 5.5kWp of panels. Let’s change the assumptions and say that for those additional panels and a bigger inverter it would cost another £1000, so that’s £7000 installation costs. This gives us an extra 30% generation capacity, and if we plug that data into the spreadsheet we bring the break-even point down to just over 12 years.
So what does that mean for me then? Well, the question was Should I get North facing panels? And I think the answer is no, not right now. If money were no object then I would definitely do it as it helps minimise my impact on the grid. But, at the moment I think that £7000 could be more wisely spent on other modifications to my home such as perhaps an additional battery or more importantly replacing my ageing boiler with an air source heat pump. Now obviously this is a very rough estimate, there are many other factors that you can consider to improve the accuracy of this payback estimate and I’m sure many of you will let me know those in the video's comments!

If you'd like to have a play with the data yourself then I've put a link to the spreadsheet above. This version is slightly different to the one in the screenshots/video because I've added parameters for you to include your current import tariff and export tariff unit rates which will be pulled into the main table automatically. I've left my 2022 generation data in there for you too just so as you've got something to work with, but you can obviously replace any data in there with your own! Anyway I hope you found this useful in some way, perhaps to help you make your own mind up if you were considering north-facing panels.