Octopus Smart Tariffs and Home Assistant’s Energy Dashboard

Update 14th October 2025: The Intelligent Octopus Go automation must now be triggered by the "off_peak" sensor associated with your import electricity meter rather than the "intelligent_dispatching" sensor shown in the video.
Update 1st July 2024: Amended Octopus Go to have 5 off-peak hours and Cosy Octopus to have three off-peak periods per day.
A while back I published a video showing you how to configure Home Assistant’s Energy Dashboard to display your peak and off-peak energy usage. I had a lot of feedback on that asking how to do that for more complex energy tariffs, like Cosy Octopus that has three different rates at different times of the day. Well, today I’m going to go through some specific examples of how to configure the dashboard to track various smart tariffs from Octopus.
Getting the dashboard working with smart tariffs, so that’s an energy tariff that has different rates at different times of the day, requires a bit of effort. Now this only works really with smart tariffs that have defined rate periods. So what do I mean by that? Well, Octopus Go for example has an off-peak period of 00:30 until 05:30, and then the rest of the day is peak - there are two specifically defined rates: a peak rate and an off-peak rate. Compare that with a tariff such as Agile where the rate changes every 30 minutes, or Tracker where the rate is different every day. There’s no set period of peak or off-peak rates that you can track, just lots of varying points. Tracking tariffs like Agile and Tracker using the methods I’m going to show you here is just not possible. You can track Agile and Tracker energy costs and usage in the dashboard, but it’s dealt with a bit differently and I’ll probably cover that in a future video/article.
For this tutorial I’m going to concentrate on 5 specific Octopus smart tariffs:
- Octopus Go which has a single off-peak period per day and the rest of the day is considered peak.
- Intelligent Octopus Go which has an extended single off-peak period per day, plus ad-hoc off-peak hours during the rest of the day if Octopus deem it appropriate, and then the rest of the day is considered peak.
- Octopus Flux which is designed for home battery owners and gives you three hours off-peak between 2am and 5am, then a peak period between 4pm and 7pm, and the rest of the day at a standard rate.
- Intelligent Octopus Flux which is also designed for home battery owners but you give Octopus control of your charging and discharging schedule. This has a peak period between 4pm and 7pm, with the rest of the day at a standard rate.
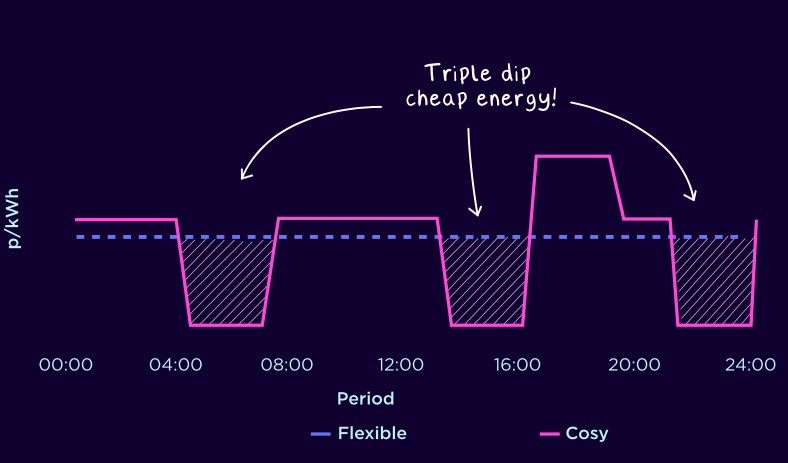
- Cosy Octopus which is intended for heat pump owners. This tariff has three off-peak periods, one between 4am and 7am, another between 1pm and 4pm, and a third between 10pm and midnight. There’s also a peak rate from 4pm to 7pm, and the rest of the day is charged at a standard rate.

Step One: Create a Utility Meter
In order for Home Assistant to be able to display the various differing cost periods of your tariff, we must first model it somehow. We do this by creating a Utility Meter helper. Navigate to Setting > Devices & Services > Helpers (tab at the top). Create a new helper of the type 'Utility Meter'.
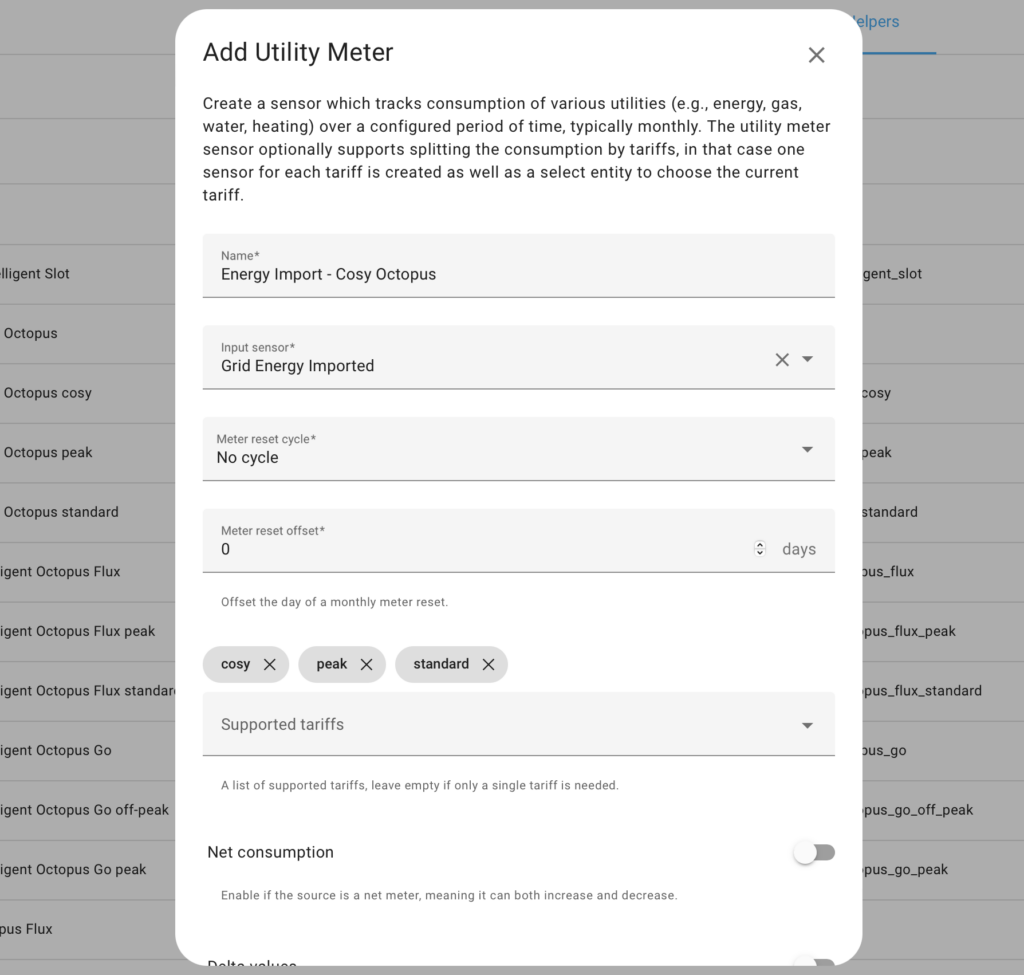
In the example in the images above we are modelling the Cosy Octopus tariff. This has three periods at a rate named 'cosy', a higher cost 'peak' rate, and everything else at a 'standard' rate. Therefore in the utility meter we must add three values to the 'Supported tariffs' section named exactly this. Note: make sure they are named exactly like this if you are using my automations in the following section, and that includes the name of the utility meter too. This way you will be able to copy and paste it without having to amend anything.
The 'Input sensor' of the utility meter should be an entity tracking your imported cumulative grid energy (in kWh). This might be from your smart meter, or any other device you might have monitoring your grid power and energy such as CT clamp sensor, a solar inverter, or a car charger.
Step Two: Automation
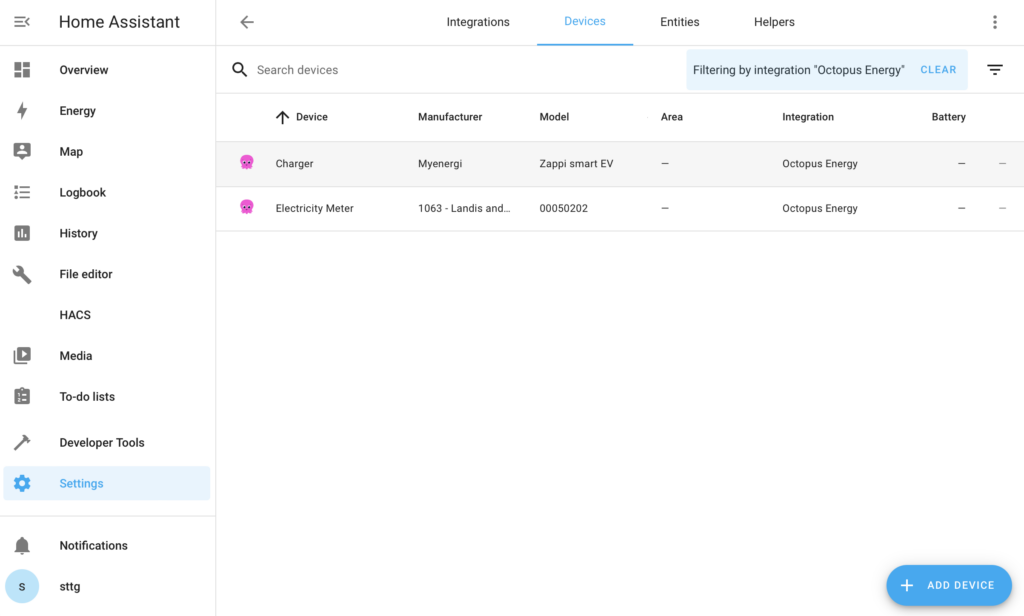
The next task is to create an automation that switches your utility meter between the different rates you have configured. In the case of Octopus Go, Cosy Octopus, Octopus Flux and Intelligent Octopus Flux this is very simple as the different rates are switched at specific static times of the day. Intelligent Octopus Go is slightly trickier however due to its ability to provide you with ad-hoc off-peak hours in addition to the fixed 5 hours of off-peak you get as standard. To work around this you must install and configure the Octopus Energy integration, available via HACS. Once configured you will be presented with new devices - locate the Home Assistant device associated with your import electricity meter. Within that device you will find a binary sensor named 'Off Peak'. This sensor will turn on whenever there's an off-peak period, which may be a scheduled period or an ad-hoc one. Locate the entity ID for this sensor and make a note of it - you'll need to update the automation with that entity ID for it to work properly.

Create a new automation, switch to YAML mode, and paste in one of the automations below depending on the tariff you are configuring. Pay close attention to the names of the tariffs in the 'variables' lines because these must match exactly with those configured in the utility meter. The entity ID of the utility meter must also match exactly with the one you created, and don't forget if you are configuring Intelligent Octopus Go to make sure you update in two places the entity ID of the 'Off Peak' sensor.
Octopus Energy using my referral link:
speaktothegeek.co.uk/energy

Existing customer? Find out how you can benefit too. T&Cs apply (only one switching offer per household)
alias: Import Energy Tariff Change - Octopus Go
description: ""
trigger:
  - platform: time
    at: "00:30:00"
    variables:
      tariff: off-peak
  - platform: time
    at: "05:30:00"
    variables:
      tariff: peak
condition: []
action:
  - service: select.select_option
    target:
      entity_id: select.energy_import_octopus_go
    data:
      option: "{{ tariff }}"
mode: single
alias: Import Energy Tariff Change - Octopus Flux
description: ""
trigger:
  - platform: time
    at: "02:00:00"
    variables:
      tariff: off-peak
  - platform: time
    at: "05:00:00"
    variables:
      tariff: standard
  - platform: time
    at: "16:00:00"
    variables:
      tariff: peak
  - platform: time
    at: "19:00:00"
    variables:
      tariff: standard
condition: []
action:
  - service: select.select_option
    target:
      entity_id: select.energy_import_octopus_flux
    data:
      option: "{{ tariff }}"
mode: single
alias: Import Energy Tariff Change - Intelligent Octopus Flux
description: ""
trigger:
  - platform: time
    at: "16:00:00"
    variables:
      tariff: peak
  - platform: time
    at: "19:00:00"
    variables:
      tariff: standard
condition: []
action:
  - service: select.select_option
    target:
      entity_id: select.energy_import_intelligent_octopus_flux
    data:
      option: "{{ tariff }}"
mode: single
alias: Import Energy Tariff Change - Cosy Octopus
description: ""
trigger:
  - platform: time
    at: "04:00:00"
    variables:
      tariff: cosy
  - platform: time
    at: "07:00:00"
    variables:
      tariff: standard
  - platform: time
    at: "13:00:00"
    variables:
      tariff: cosy
  - platform: time
    at: "16:00:00"
    variables:
      tariff: peak
  - platform: time
    at: "19:00:00"
    variables:
      tariff: standard
  - platform: time
    at: "22:00:00"
    variables:
      tariff: cosy
  - platform: time
    at: "00:00:00"
    variables:
      tariff: standard
condition: []
action:
  - service: select.select_option
    target:
      entity_id: select.energy_import_cosy_octopus
    data:
      option: "{{ tariff }}"
mode: single
alias: Import Energy Tariff Change - Intelligent Octopus Go
description: ""
trigger:
  - platform: state
    entity_id:
      - binary_sensor.octopus_energy_electricity_off_peak
    from: "off"
    to: "on"
    variables:
      tariff: offpeak
  - platform: state
    entity_id:
      - binary_sensor.octopus_energy_electricity_off_peak
    from: "on"
    to: "off"
    variables:
      tariff: peak
condition: []
action:
  - service: select.select_option
    target:
      entity_id: select.energy_import_intelligent_octopus_go
    data:
      option: "{{ tariff }}"
mode: single
Step Three: Leave it for 24 hours!
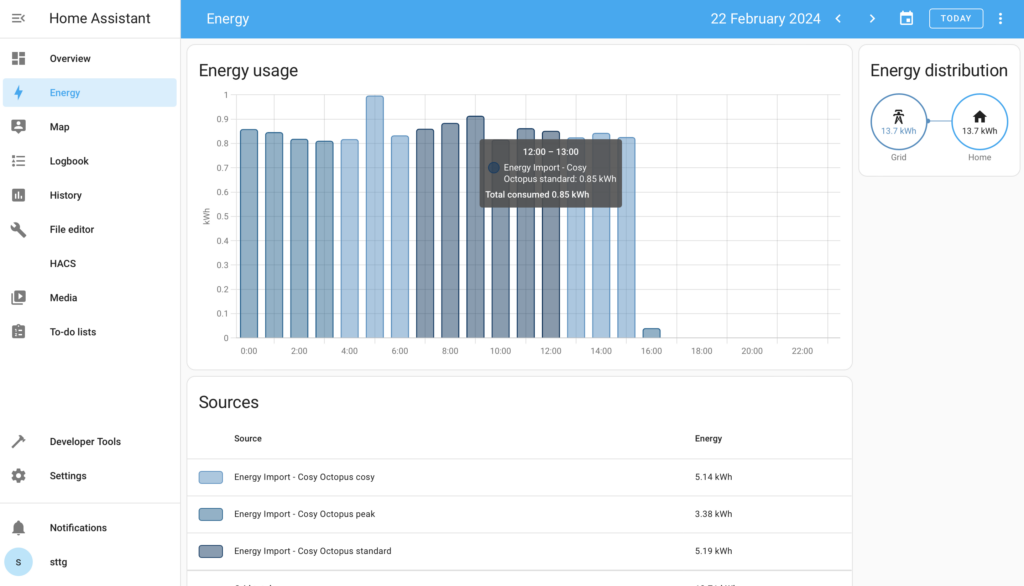
Now it’s very important that you leave this for a day, a full 24 hours. The reason is that until those utility meters have started populating with data, you just can’t add them to your energy dashboard. After 24 hours, hopefully all three of those different rates, so cosy, peak and standard will have so data in them to display. Once they do then you’re ready to configure the energy dashboard.
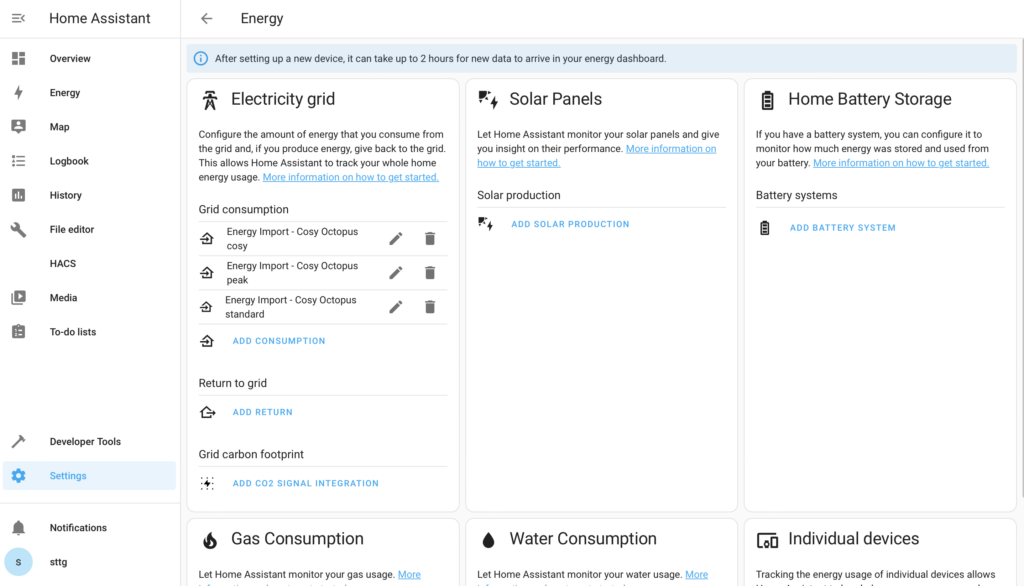
Step Four: Configure the Energy Dashboard
Navigate to Settings > Dashboards > Energy and locate the 'Electricity Grid' section. Click on 'Add Consumption and locate one of the sub-entities for the utility meter you created. For example, if you are configuring Cost Octopus then you will have three sub-entities: one for 'cosy'; one for 'peak'; and one for 'standard'. Add all three sub-entities to the consumption configuration. Within a couple of hours you should be able to open the Energy Dashboard itself and browse your energy data, each rate represented by a different colour.