Local UK Grid Carbon Intensity in Home Assistant

Built-in to Home Assistant is the CO2signal integration which grabs the current grid carbon intensity for your country to use in Home Assistant. You can use this data to view how much of the energy that you drew from the grid was low carbon or green. But if you live in the UK then the problem with CO2signal is that carbon intensity can vary dramatically across the country. If you’re up in Scotland then a lot of the time you are running fully on renewables such as wind and hydro, but down in South Wales there’s almost always a significant generation from gas, so here’s a way to get your local regional grid carbon intensity data.
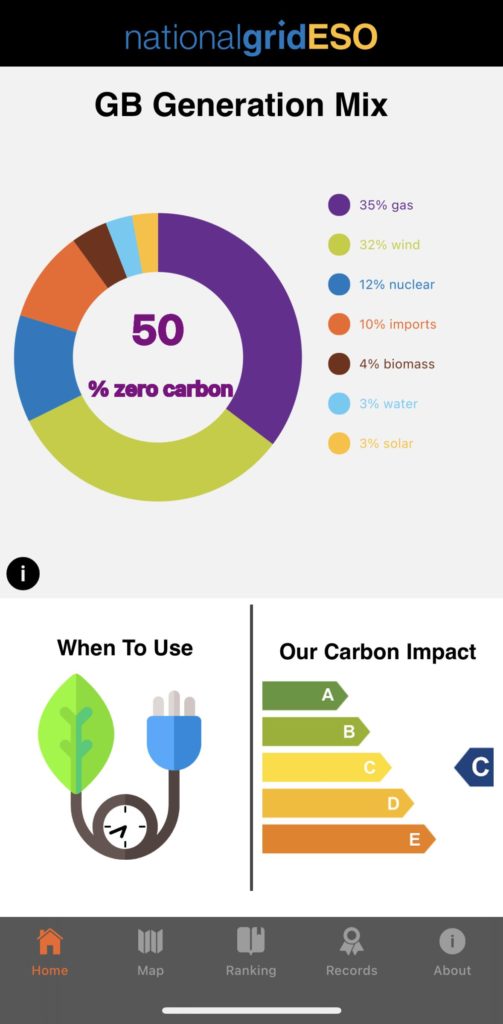
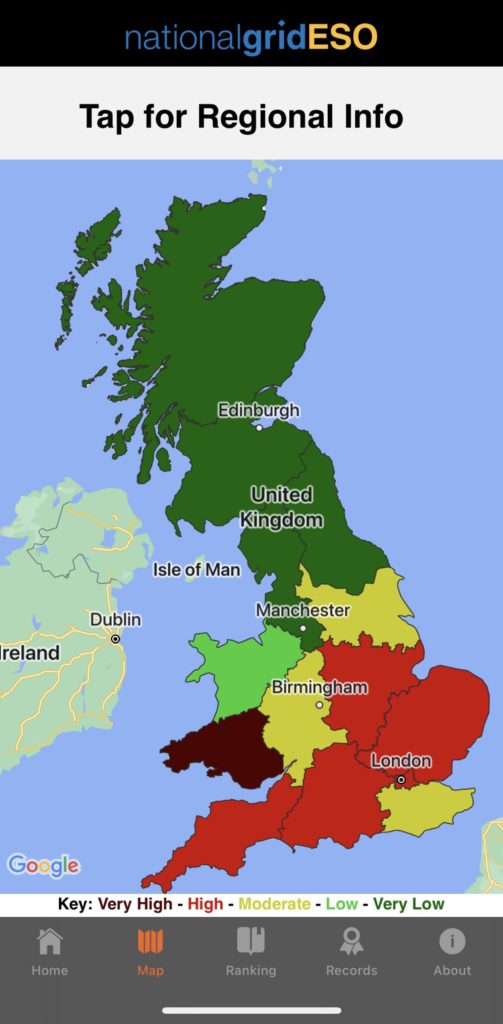
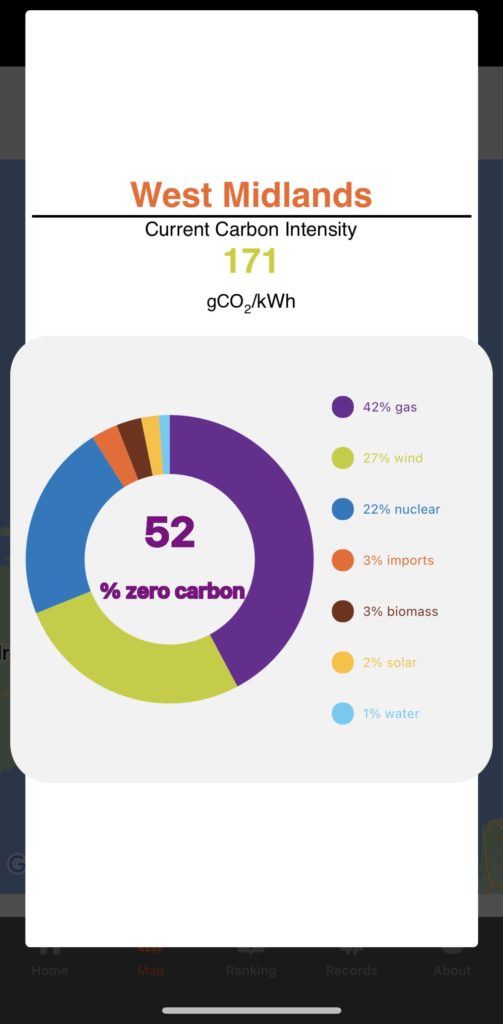
The National Grid ESO actually break down the UK into 14 regions and you can browse a breakdown of current generation data for each of those regions using the ESO app. But more importantly the ESO make that data available via a public API (see the API documentation here). You can query their API for free and they’ll provide you with data on things like the carbon intensity of current and historical time periods, and the mix of generation such as solar, gas, coal, nuclear and so on but the data we’re interested in here is the regional carbon intensity data. You can feed the API your postcode and it’ll send you a full breakdown of the current generation and carbon intensity in one go. Of course, to use this in Home Assistant you’ll need to do a bit of work first.
You will need a way to edit your configuration files. I suggest installing the File Editor add-on by going to Settings > Add-ons. If you're not sure how to do that I suggest you follow the video associated with this article because it's a lot easier to demonstrate than it is to explain in writing!
Once you have File Editor installed, open it up and open your configuration.yaml file. Find a blank section near the end of the file and paste in the following bit of configuration:
rest:
  - resource: https://api.carbonintensity.org.uk/regional/postcode/W1A
    scan_interval: 3600
    sensor:
      - name: "Carbon Intensity Regional Fossil Fuel Percentage"
        unique_id: "carbon_intensity_regional_fossil_fuel_percentage"
        value_template: >-
            {% set ns = namespace(perc_lowcarbon = 0.0) %}
            {% for generationmix in value_json.data[0].data[0].generationmix %}
              {% set lowcarbon=['wind','solar','hydro','nuclear'] %}
              {% for fuel in lowcarbon %}
                {% if fuel == generationmix.fuel %}
                    {% set ns.perc_lowcarbon = ns.perc_lowcarbon + (generationmix.perc|float(default=0)) %}
                {% endif %}
              {% endfor %}
            {% endfor %}
            {{ (100 - ns.perc_lowcarbon|float(default=0))|round(2) }}
        state_class: measurement
        unit_of_measurement: '%'
        icon: mdi:molecule-co2
      - name: "Carbon Intensity Regional Green Fuel Percentage"
        unique_id: "carbon_intensity_regional_green_percentage"
        value_template: >-
            {% set ns = namespace(perc_green = 0.0) %}
            {% for generationmix in value_json.data[0].data[0].generationmix %}
              {% set lowcarbon=['wind','solar','hydro'] %}
              {% for fuel in lowcarbon %}
                {% if fuel == generationmix.fuel %}
                    {% set ns.perc_green = ns.perc_green + (generationmix.perc|float(default=0)) %}
                {% endif %}
              {% endfor %}
            {% endfor %}
            {{ (ns.perc_green|float(default=0))|round(2) }}
        state_class: measurement
        unit_of_measurement: '%'
        icon: mdi:molecule-co2
      - name: "Carbon Intensity Regional"
        unique_id: "carbon_intensity_regional"
        value_template: "{{ value_json.data[0].data[0].intensity.forecast }}"
        state_class: measurement
        unit_of_measurement: 'gCO2eq/kWh'
        icon: mdi:molecule-co2
Before you save it, you’ll need to edit the resource URL. The characters after the last forward slash are the first half of the postcode that you want to obtain the data for. I’ve used the postcode W1A for the BBC in London just as an example here.
Once you’ve changed the post code, save the configuration then go to Developer Tools, check the configuration, and restart Home Assistant to apply it. Once it’s rebooted, go to Settings > Devices & Services > Entities (tab) and filter by “Carbon Intensity”. You should see three different entities.
- "Carbon Intensity Regional Fossil Fuel Percentage" is the percentage of the current generation that comes from fossil fuels. You can use this entity in something like the Power Flow Card Plus to display the low-carbon energy flows.
- "Carbon Intensity Regional Green Fuel Percentage" is the percentage of the current generation that comes only from green sources such as solar, wind and hydro.
- Finally there's "Carbon Intensity Regional" which is actual grid carbon intensity value for your local area, measured in grams of CO2 per kWh.
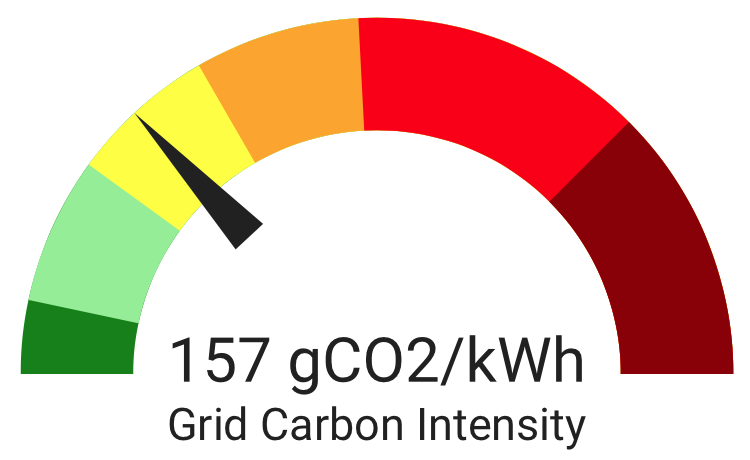
I think it’s important to be aware of how green the energy is that you are using, and being able to see a more accurate value is handy if you’re automating things such as charging your car or home battery based on how clean your imported energy is. To help with that visibility you can create a gauge on your dashboard to show you that at a glance. The ESO have defined certain bands of carbon intensity from very low right the way up to very high and these bands change every year.
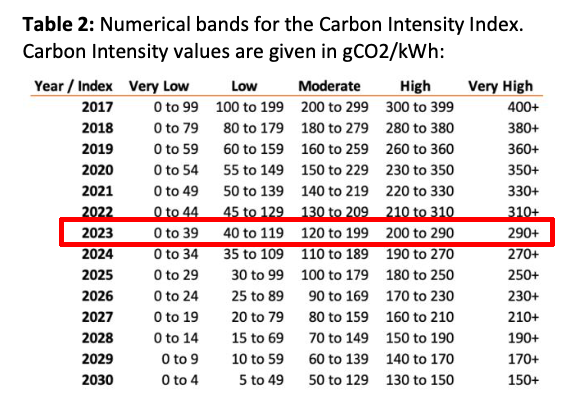
The image above is from the ESO’s Carbon Intensity Forecast Methodology document and you can see that for 2023 the band Very Low is defined as a carbon intensity of 0-39, and so on.
Edit your dashboard and add a new card of type Gauge. Switch to edit the card in YAML mode and paste in the following over the top of the existing configuration:
type: gauge
entity: sensor.carbon_intensity_regional
name: Grid Carbon Intensity
needle: true
segments:
  - from: 0
    color: green
  - from: 40
    color: lightgreen
  - from: 120
    color: yellow
  - from: 200
    color: orange
  - from: 290
    color: red
  - from: 450
    color: darkred
max: 600
unit: gCO2/kWh
This should give you an attractive gauge with a needle pointing at the current CO2 intensity band. Each band is a colour-coded segment matching the 2023 bands defined by the ESO. That is with the exception of the final dark red section which I have added for dramatic effect.